Crating a Python script to control the GPIO of my Raspberry Pi
To practice for my CCNP ENCOR I've been creating simple Python scripts recently. I've got a few Raspberry Pis and temperature sensors lying around at home. So I though I try out how we can control the GPIOs depending on the temperature with Python.
The task
The idea for this script came from my workplace: to control the temperature of the rooms where all the telecom equipment are located we use two air conditioners (AC) for redundancy and a dedicated PLC to control the ACs. The logic of the PLC is following: by default if the room's temperature is below a predefined threshold (25 degrees Celsius for example) only a single AC is operating. If the temperature exceeds the predefined threshold, the second AC is turned on to help cool down the room. Besides that, if the temperature is below the threshold, the PLC changes the active AC at regular predefined intervals (every 5 hour for example) to provide load balancing and to avoid the situation where only the same AC is operating all the time.
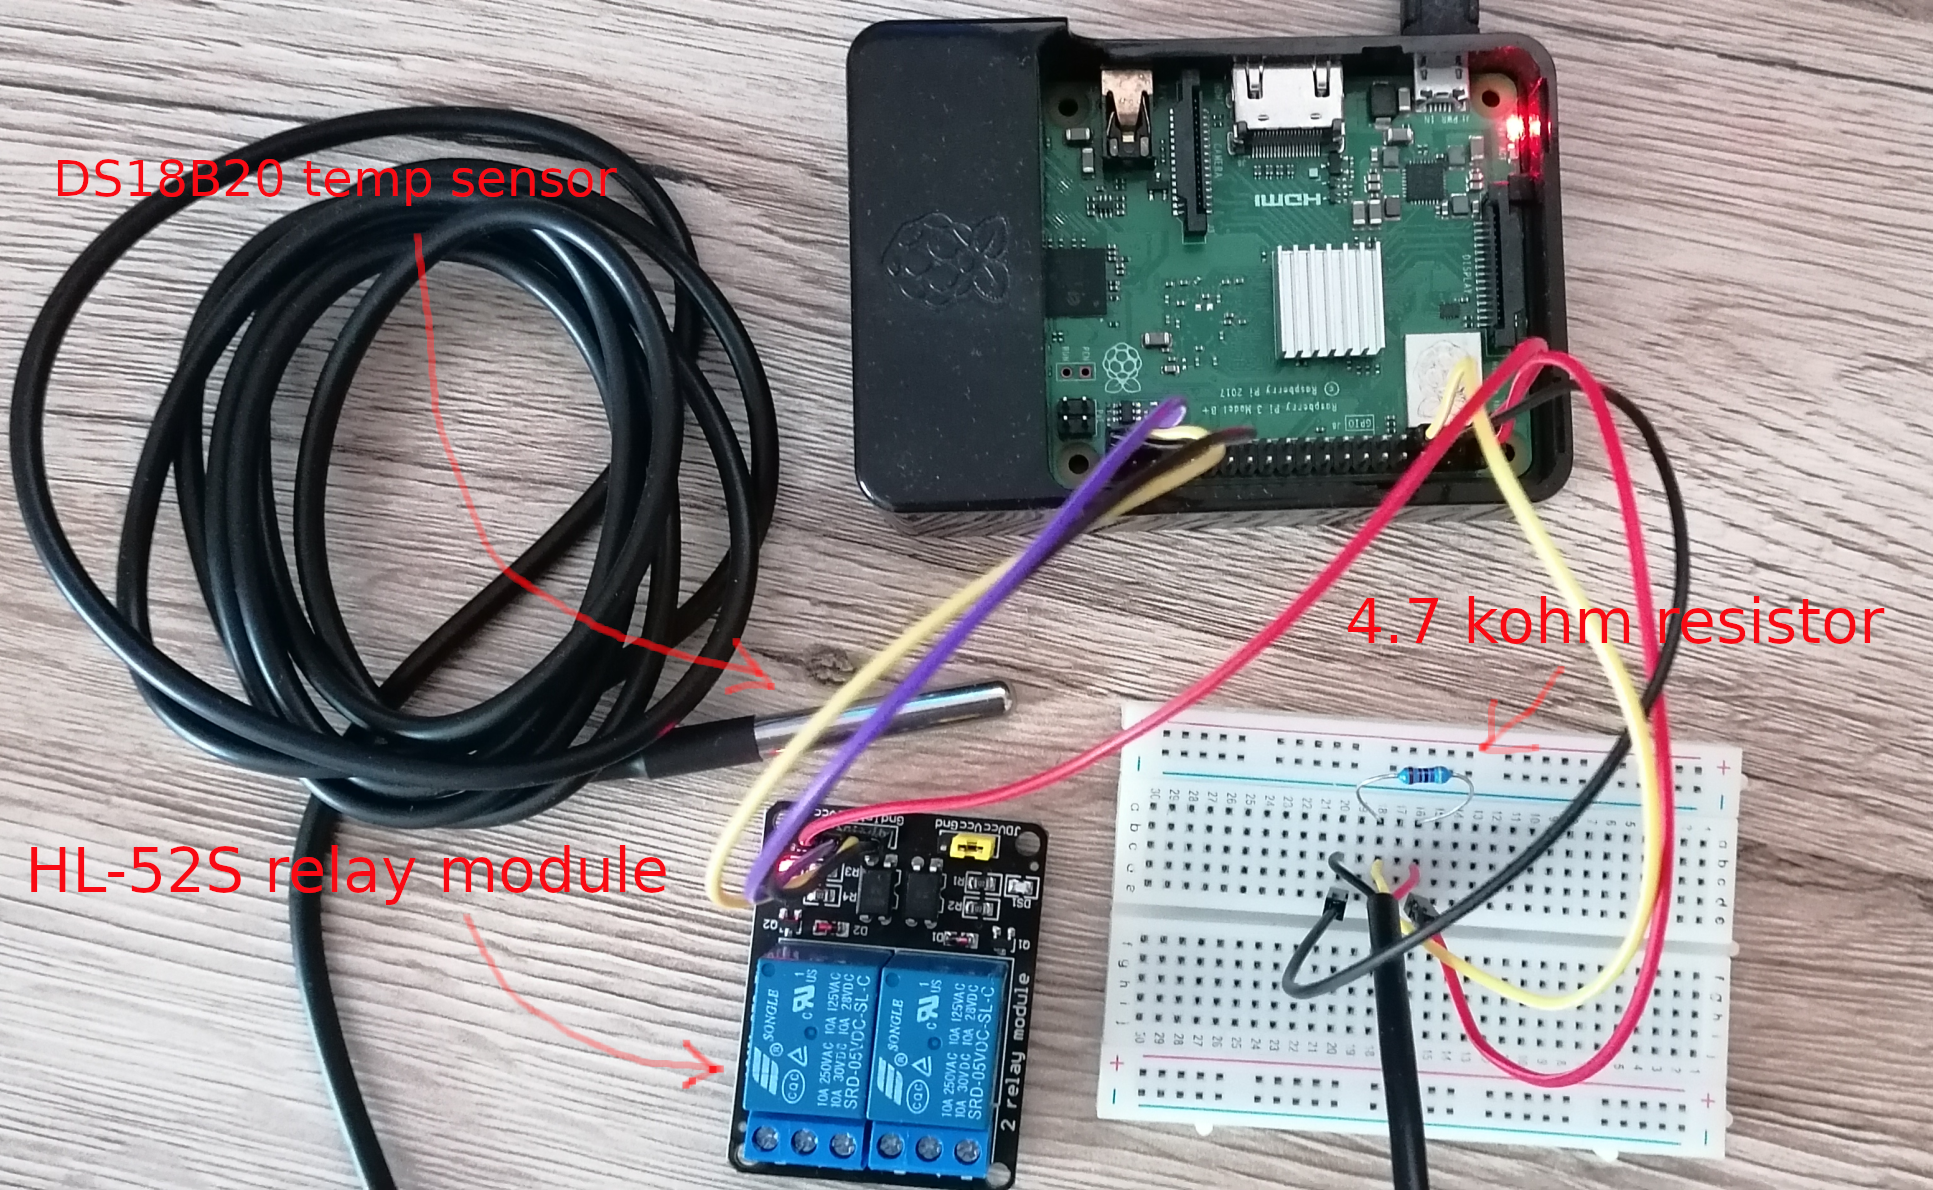
So this is the logic what I want to program using Python and the GPIOs. I use a DS18B20 sensor to measure the temperature, and a HL-52S relay module to provide the NO/NC contact which would normally control the ACs. On top of that the Python script should also log the measured results. We'll put these into InfluxDB database, and display later with Grafana.
So this is how I put these all together:
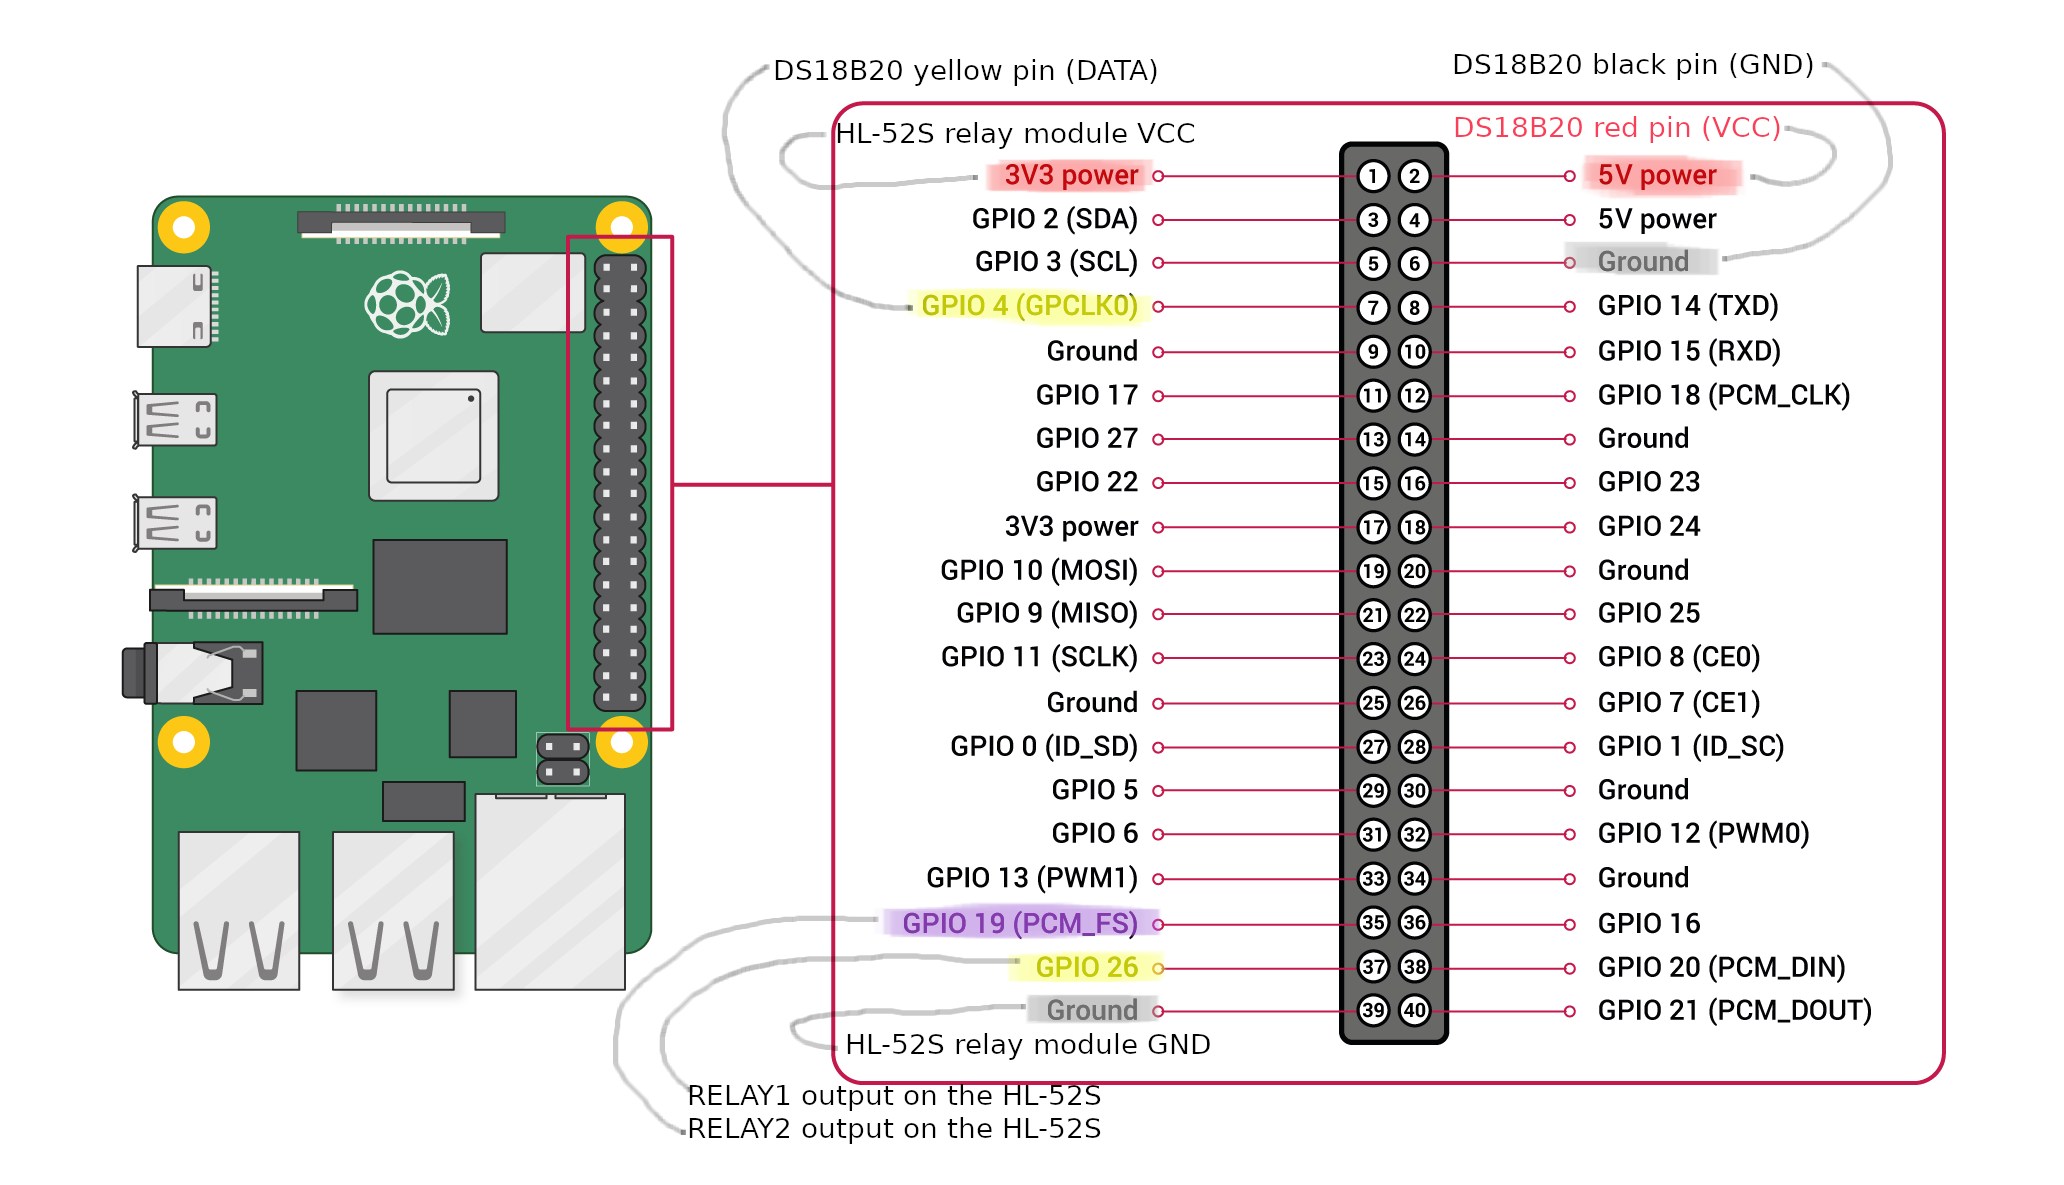
I tried to color the GPIO pins with the same color as I use with the jumper wires which you can see on the picture below. Also notice that we need a resistor between the yellow (data) and red (VCC) pins of the DS18B20 sensor, I use a 4.7 kohm resistor here, but I suppose a 10 kohm (or even above) would work as well. With the HL-52S relay module we can have an NC or an NO contact as an output for the ACs, or we can even switch 230V and 10 A if we want.
Feel free to download the Python script from my Github repo, in the followings I'll explain how it works, and what we have to do and install beforehand.
Configuring the Pi: enabling kernel modules and installing required packages
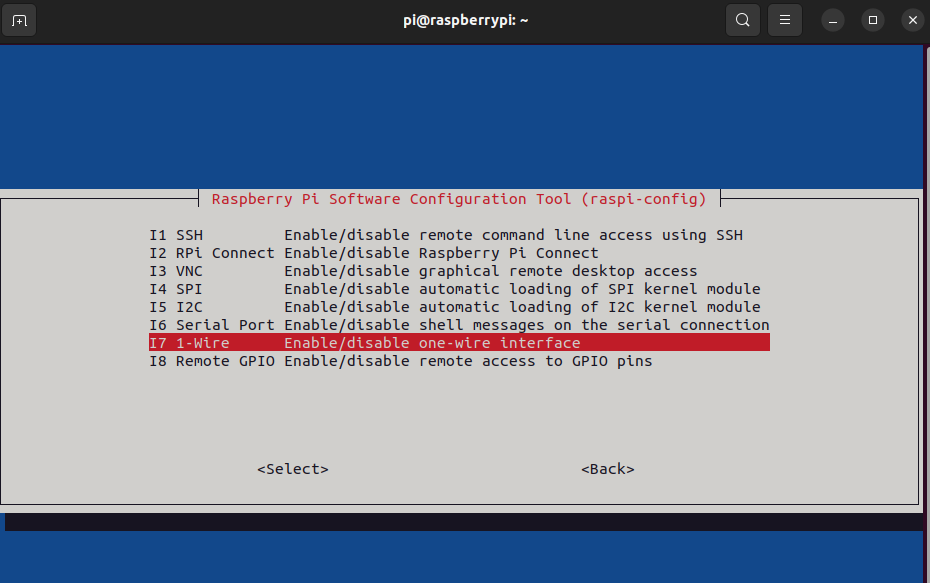
First we have to enable the 1-Wire interface for the temperature sensor on the Raspberry Pi. To do this we either issue the
pi@raspberrypi:~ $ sudo raspi-config
command and enable the 1-Wire interface manually:
or we could issue the following commands to load the kernel modules and any required dependencies:
pi@raspberrypi:~ $ sudo modprobe w1_gpiopi@raspberrypi:~ $ sudo modprobe w1_therm
Either way we can confirm that the kernel modules are loaded properly if we run the following command (if you use the raspi-config, you might need to reboot the Raspberry Pi first):
pi@raspberrypi:~ $ lsmod | grep w1w1_therm 24576 0w1_gpio 12288 0wire 40960 2 w1_gpio,w1_therm
Now if we display the contents of the following file:
pi@raspberrypi:~ $ cat /sys/bus/w1/devices/28-3c1fe3814d7c/w1_slave 92 01 55 05 7f a5 a5 66 32 : crc=32 YES92 01 55 05 7f a5 a5 66 32 t=25125
We can confirm that the DS18B20 sensor is working properly. Note that the number under the devices directory will be different for you, this is a unique number identifying the sensor. The temperature measured is 25.125 C right now, we have to divide the 't' value by 1000.
Now we need to install the w1thermsensor and the influxdb modules for the Python script:
pi@raspberrypi:~ $ sudo apt install python3-influxdbpi@raspberrypi:~ $ sudo pip install --break-system-packages w1thermsensor
Besides these, we'll also need the RPi.GPIO module, but this is usually installed by default. Now we need to install InfluxDB which I've already showed how we can do in this post: Monitor your system’s power consumption using Node-RED and Grafana
Next we create username with a password in InfluxDB like this:
pi@raspberrypi:~ $ influxConnected to http://localhost:8086 version v1.11.8InfluxDB shell version: v1.11.8> CREATE USER ds18b20 WITH PASSWORD '123456' WITH ALL PRIVILEGES
and also create a database which will be used by the Python script:
pi@raspberrypi:~ $ influxConnected to http://localhost:8086 version v1.11.8InfluxDB shell version: v1.11.8> CREATE DATABASE temp_meas> SHOW DATABASESname: databasesname----_internaltemp_meas
Running the Python script
Remember these, later we'll refer back to these in the Python script. That's all we need to do beforehand, now we can run the script. You can download this from my Github repo, but I also paste it here:
import RPi.GPIO as GPIOimport timefrom influxdb import InfluxDBClientfrom w1thermsensor import W1ThermSensor#USER INPUTS:#SPECIFY THE TARGET TEMPERATURE IN CELSIUS,#THE HYSTERESIS IN CELSIUS TO PREVENT BOUNCING,#AND THE CHANGE INTERVAL IN SECONDStarget_temp = 26hyst = 0.5change_interval = 10GPIO.setmode(GPIO.BOARD)sensor = W1ThermSensor()RELAY1 = 37RELAY2 = 35i=0j=0GPIO.setup(RELAY1, GPIO.OUT)GPIO.setup(RELAY2, GPIO.OUT)def influx_measurement():temp_meas_data = [{"measurement" : "temp_meas","tags" : {"host" : "192.168.1.97"},"fields" : {"ds18b20_temp" : float(temperature)}}]client = InfluxDBClient('localhost', 8086, 'ds18b20', '123456', 'temp_meas')client.write_points(temp_meas_data)GPIO.output(RELAY1, GPIO.LOW)GPIO.output(RELAY2, GPIO.HIGH)temperature = sensor.get_temperature()influx_measurement()print("System startup... the temperature is %s C AC1=ON, AC2=OFF" % temperature)time.sleep(1)try:while True:if temperature > target_temp:while temperature > (target_temp - hyst):GPIO.output(RELAY1, GPIO.LOW)GPIO.output(RELAY2, GPIO.LOW)temperature = sensor.get_temperature()influx_measurement()print("AC1=ON, AC2=ON OVERTEMP %s C" % temperature)time.sleep(1)while i < change_interval:temperature = sensor.get_temperature()influx_measurement()if temperature > target_temp:breakGPIO.output(RELAY1, GPIO.LOW)GPIO.output(RELAY2, GPIO.HIGH)print("AC1=ON, AC2=OFF normal operation " + str(temperature) + " C. " + str(change_interval-i) + " seconds until AC change.")i+=1time.sleep(1)i=0while j < change_interval:temperature = sensor.get_temperature()influx_measurement()if temperature > target_temp:breakGPIO.output(RELAY1, GPIO.HIGH)GPIO.output(RELAY2, GPIO.LOW)print("AC1=OFF, AC2=ON normal operation " + str(temperature) + " C. " + str(change_interval-j) + " seconds until AC change.")j+=1time.sleep(1)j=0except KeyboardInterrupt:GPIO.cleanup()exit()
At the top I use three variables: with the target_tempwe can define the maximum temperature, if the temperature exceeds this value OVERTEMPcondition occurs and the second AC will be turned on (we change the state of the GPIO output). I also use a hystvalue to prevent bouncing: in this example the second AC would be turned on at 26.5 C, and would be turned off at 25.5 C. The change_intervalvariable defines how often the ACs (GPIO outputs) should change under normal operation. I set this to 10 seconds in this example to verify that the script works properly. In a real world environment you would set this to a much higher value of course. With the influx_measurement()function we write the temperature values into the temp_measdatabase about every second which we've created above. Replace the "host" : "192.168.1.97"IP address with the IP address of your own Pi here. Also in this row:
client = InfluxDBClient('localhost', 8086, 'ds18b20', '123456', 'temp_meas')
replace the Influx username (ds18b20) and password (123456) with your own credentials you specified above. This is how the output of the script looks like when we run it in a terminal:
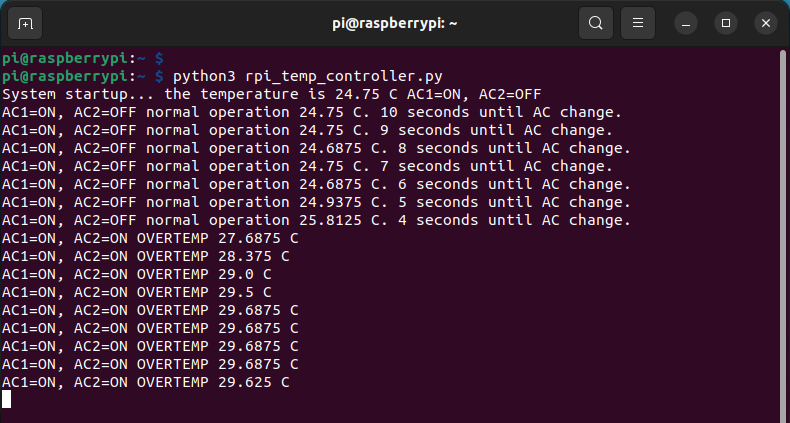
rpi_temp_controller.py script on the Raspberry PiIntegrating with Grafana
In my previous post I've also showed how we can install Grafana, so I'll skip that here. I just show how we can display the temperature data from the InfluxDB database. First we have to add the InfluxDB running on the Pi to the data sources under Configuration -> Data Sources, and we select InfluxDB. Next we specify the IP address of our Raspberry Pi in the URL section:
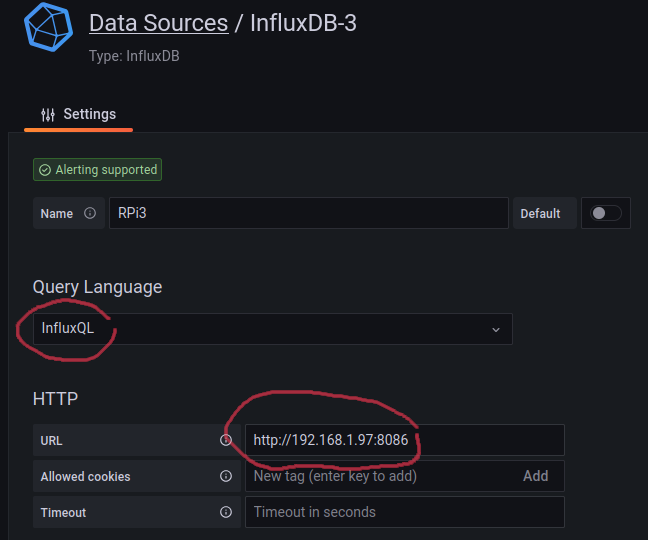
My Grafana server runs on a different Raspberry Pi, so I cannot use localhost here, also make sure that the port number of the InfluxDB service (8086) is also included in the URL. At the bottom we define the same database which we've created previously and the corresponding credentials:
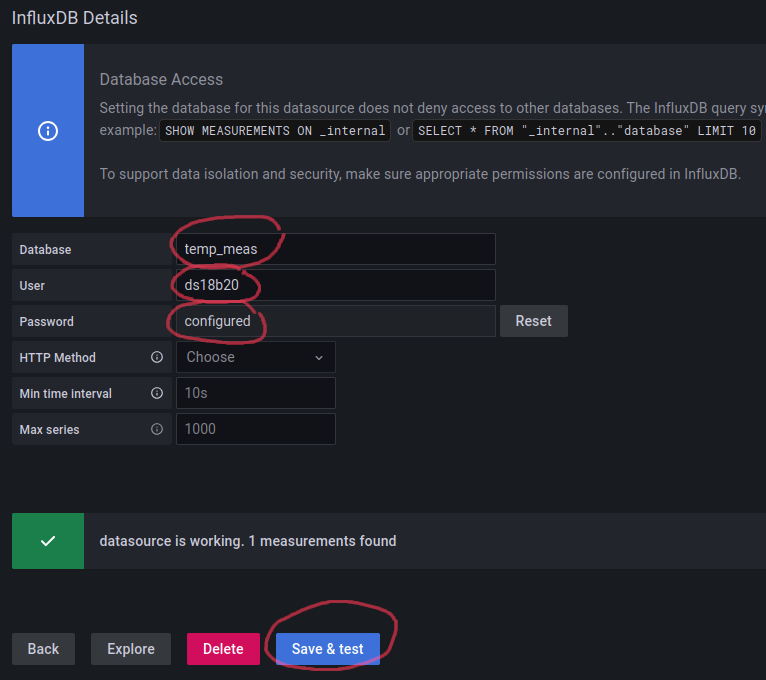
If we click 'Save & test' it should display that the datasource is working in green. Now we just need to create a new graph to display the results.
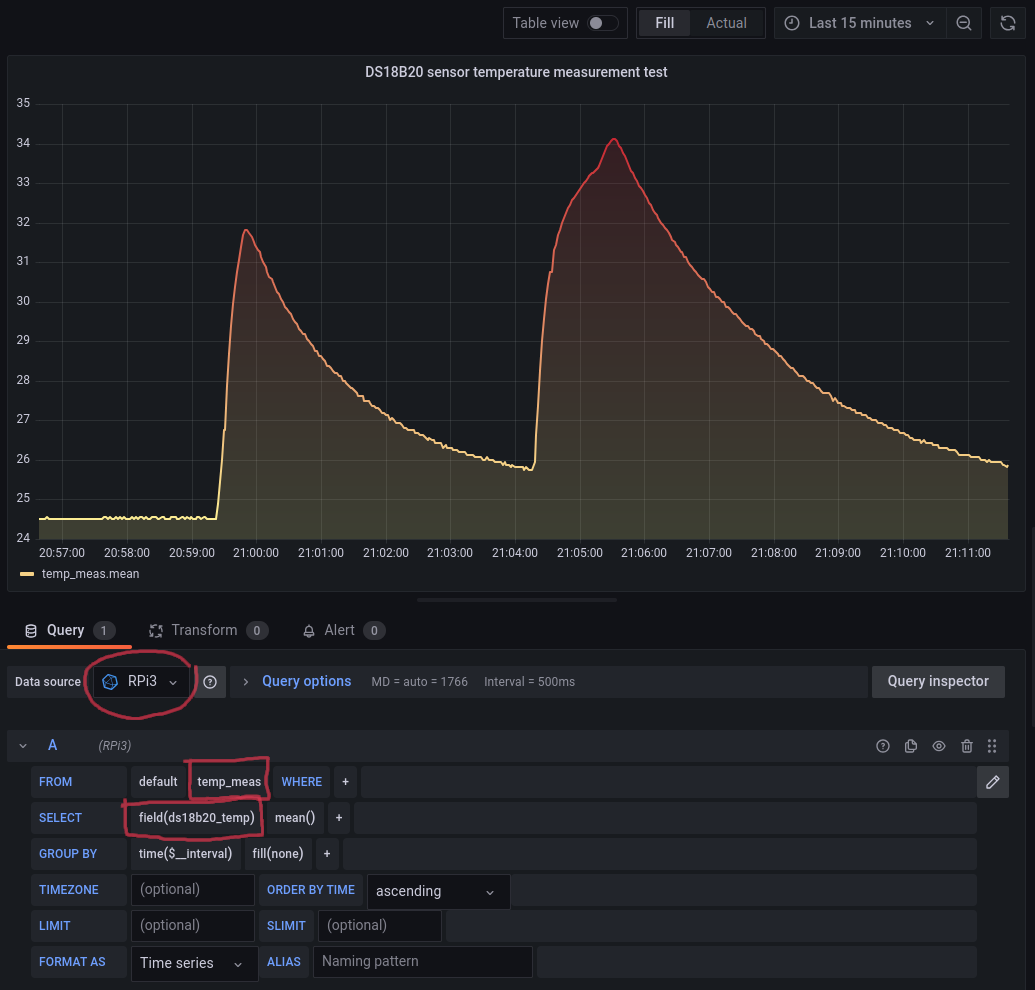
Make sure that you select the Data Source which we've just created, I called mine RPi3, and also select the correct database and measurement. After that we can color the graph and display in way we want.