Monitor your system’s power consumption using Node-RED and Grafana
In the following post I would like to introduce you Shelly’s IoT device called Shelly PlugS. With the help of this device we can turn on/off devices we’ve plugged into our socket and we can monitor the power consumption using MQTT protocol.
Configuring the Shelly PlugS is really easy. By default it will turn on into Access Point mode. After connecting to its SSID you can start your browser and open the following address: 192.168.33.1. By doing this you’ll open the webserver running on the Shelly device. On this interface Shelly can be set as a client by giving your WLAN’s SSID and password. Besides that I highly recommend assigning a static IP to your Shelly via DHCP protocol.
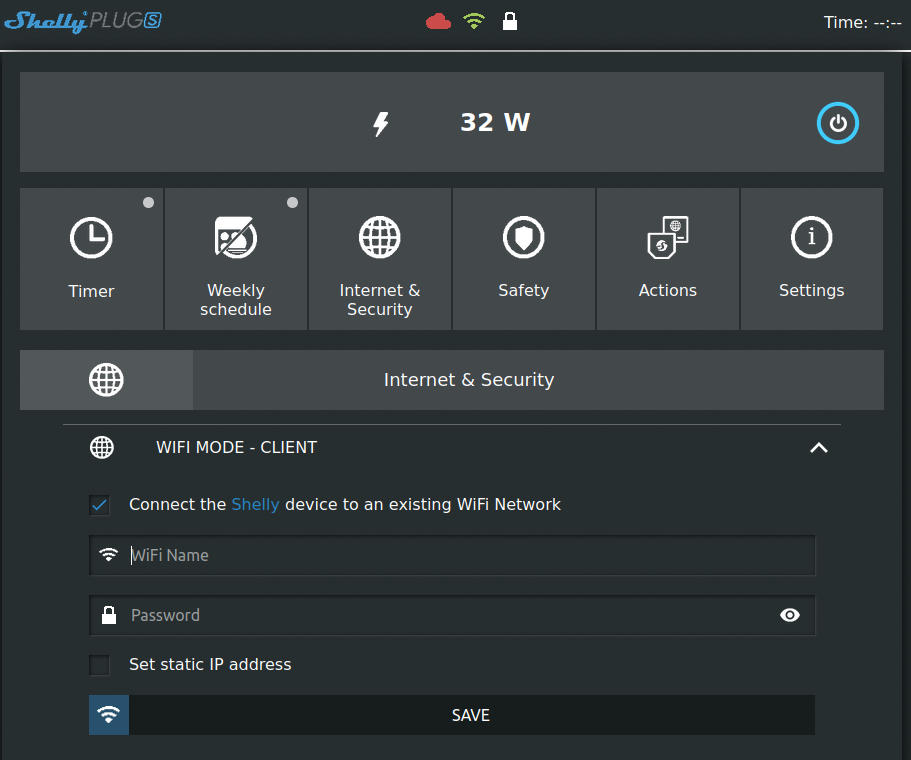
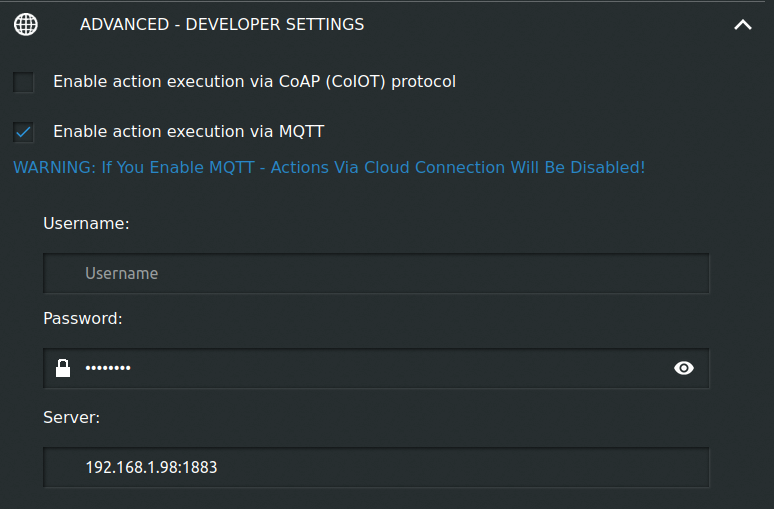
On the Shelly’s webpage we can see the momentary power consumption, but we want to store the data in a database and represent them on a graph. For this we are going to need to enable the MQTT communication on the Shelly. By checking the corresponding checkbox we need to provide the server’s IP address on which we’ll run the MQTT broker – Mosquitto (we’ll install it later). We can also add additional authentication (username/password), but you can skip this part if you use the Shelly only in your own home network.
We’ll also need a raspberry pi for this project. You can use basically any other Linux based computer you want, but I’d recommend using raspberry pi, because it’s small, silent, cheap and it’s the perfect device to learn Linux.
I’d assume you can write the Raspberry Pi OS to an SD card, and ssh into your Pi, I also recommend assigning a static IP address to your Pi via DHCP. In the image above you can see my Pi’s IP address (yours will be different), and Mosquitto’s default port number 1883. First we’re going to update our system by typing thesudo apt update and sudo apt upgrade commands.
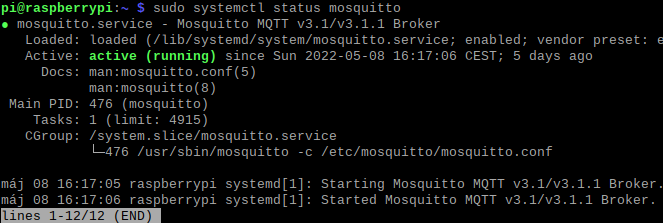
Next we’re going to install Mosquitto by typing sudo apt install mosquitto mosquitto-clients. With mosquitto-clients you can test your system, and make sure your MQTT broker works properly. Mosquitto doesn’t need to be configured, by default it will be enabled (start by the system restart), and use port 1883. You can verify it by typing sudo systemctl status mosquitto. You’ll see active (running), and enabled, means it’ll start by system startup.
Now that Mosquitto has been installed, we’ll need the database, we’ll store the data in. We’re going to install the software called InfluxDB, it’s a timestamp based database, perfect for time based data visualization in Grafana. To install InfluxDB type the following commands:
curl https://repos.influxdata.com/influxdb.key | gpg --dearmor | sudo tee /usr/share/keyrings/influxdb-archive-keyring.gpg >/dev/nullecho "deb [signed-by=/usr/share/keyrings/influxdb-archive-keyring.gpg] https://repos.influxdata.com/debian $(lsb_release -cs) stable" | sudo tee /etc/apt/sources.list.d/influxdb.list
With the first command we add the InfluxDB repository key to our Raspberry Pi, and with the second command we add it to the repository source list. Next we’ll update the package list by typing sudo apt update. Now we can install InfluxDB: sudo apt install influxdb. Next – just like Mosquitto above – we’ll enable the InfluxDB service by typing the following commands:
sudo systemctl umask influxdbsudo systemctl enable influxdbsudo systemctl start influxdb
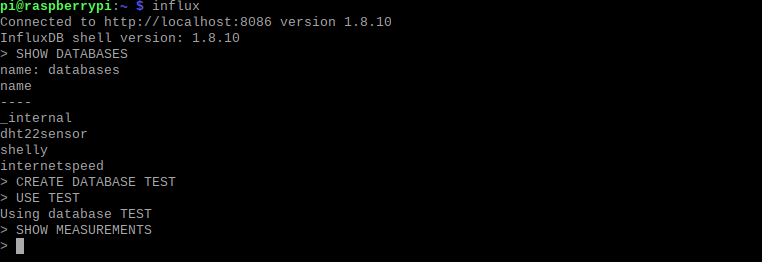
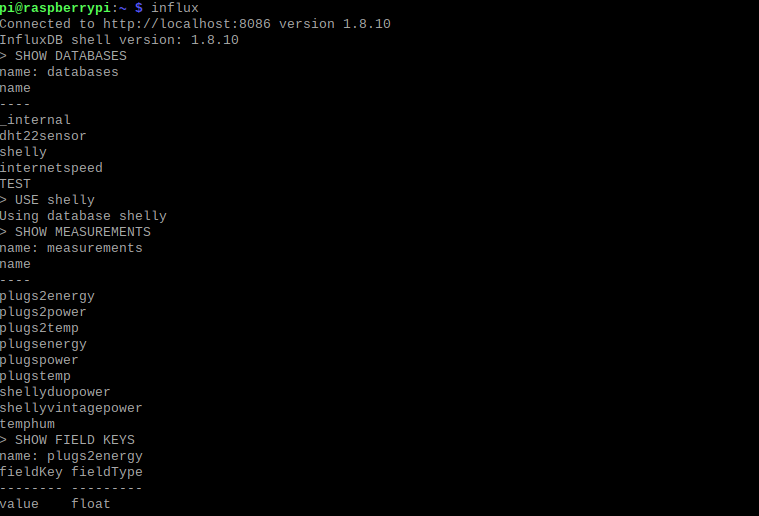
Now that InfluxDB has been set up, we’ll create a database for our measurement. Simply type influx to start InfluxDB. To create a database type CREATE DATABASE <your database name>, you can make sure that your database has been created by typing: SHOW DATABASES, just like in the example below.
Next we’re going to install Node-RED, run the following commands:
sudo apt install build-essentialbash <(curl -sL https://raw.githubusercontent.com/node-red/linux-installers/master/deb/update-nodejs-and-nodered)
sudo systemctl start nodered && sudo systemctl enable nodered. You can verify that the service is running and enabled: sudo systemctl status nodered. To start Node-RED web editor, open the following URL: http://<your Pi's IP address>:1880. To send data with timestamp to InfluxDB database, we’ll need to install an additional node: open Manage Palette (from the menu in the upper right corner) and search for node-red-contrib-influxdb, then install it.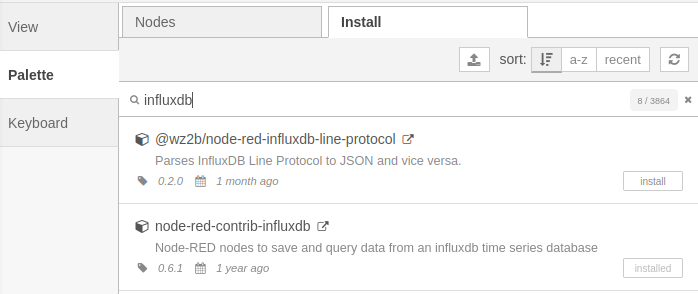
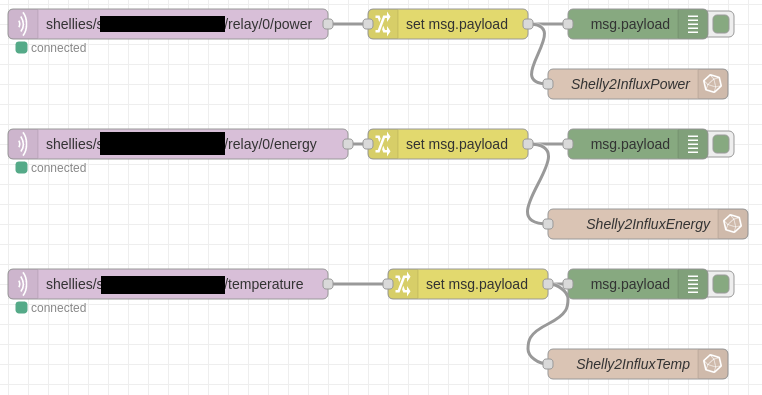
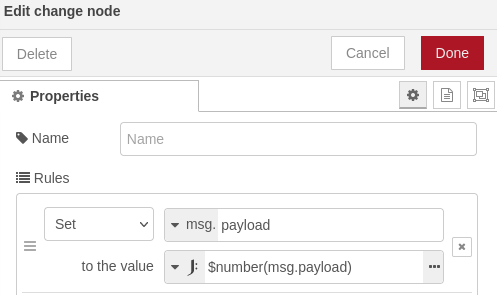
Now you are ready to assemble your flow with the required nodes (mqtt in, change function, influxdb out, and debug), which you can see in the picture above. The change function is required for the InfluxDB: the string type of payload (from the mqtt in node) needs to be converted into float type. Edit the mqtt in node the following way:
- Server:
<Your Pi's IP address:1883> - Topic:
shellies/<your Shelly's ID>/relay/0/powerfor power measurements - Topic:
shellies/<your Shelly's ID>/relay/0/energyfor energy measurements - Topic:
shellies/<your Shelly's ID>/relay/temperaturefor temperature measurements
You can check your Shelly’s ID under Advanced – Developer settings – Will topic, just like in the picture below on the black blank space.

If those topics don’t work for you for some reason, you can still test your Shelly’s MQTT messages: simply type ‘#‘ for the topic in Node-RED, by doing this you’ll receive MQTT messages in every topic in the debug menu.
Edit the change function just like in the picture below:
Edit the influxdb out node in the following way:
- Click – Server – Properties: Host: <your Pi’s IP address>
- Port: 8086
- Database: <your database name you created above>
- Measurement:
plugspower(for power measurements),plugsenergy(for energy measurements), plugstemp (for temperature measurements)
For the Measurement you can type basically anything you want, but it has to be different for each 3 topics. After you have everything wired (according to the picture above) and configured (as described), hit Deploy, and open the Debug menu in the upper right corner. Now you can see the MQTT messages the Shelly is sending for each topic, if not I suggest typing ‘#‘ for the topic as described above. You can make sure InfluxDB stores Shelly’s measured values: start InfluxDB with the influx command, enter: USE <your database name you created above>, then enter SHOW MEASUREMENTS. Now you need to see those 3 measurements you created above.
Finally we’re going to visualize the data stored in Influx with Grafana. To install Grafana you need to run the following commands:
curl https://packages.grafana.com/gpg.key | gpg --dearmor | sudo tee /usr/share/keyrings/grafana-archive-keyrings.gpg >/dev/nullecho "deb [signed-by=/usr/share/keyrings/grafana-archive-keyrings.gpg] https://packages.grafana.com/oss/deb stable main" | sudo tee /etc/apt/sources.list.d/grafana.listsudo apt updatesudo apt install grafanasudo systemctl enable grafana-serversudo systemctl start grafana-server
Just like with Node-RED, we add Grafana to our repository, install, then enable it. Open Grafana’s web interface by entering the following URL: http://<your Pi's IP address>:3000. By default enter admin/admin as username and passport, you can change it later. Next add InfluxDB to your data sources: click Configuration – Data sources – select InfluxDB. For the URL enter: http://<your Pi's IP address>:8086, and for the database below enter: <your database you created above>, now click Save & Test.
Now we can create a dashboard and add panels: simply select your database and measurement which you want to visualize.
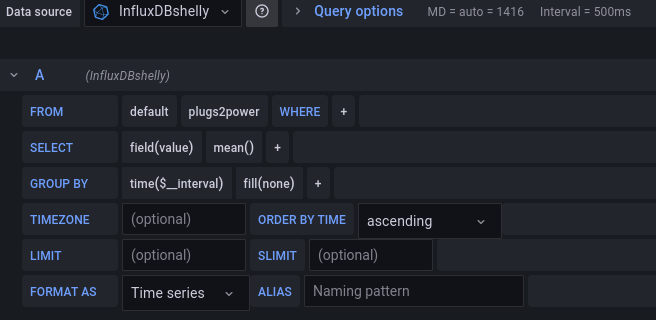
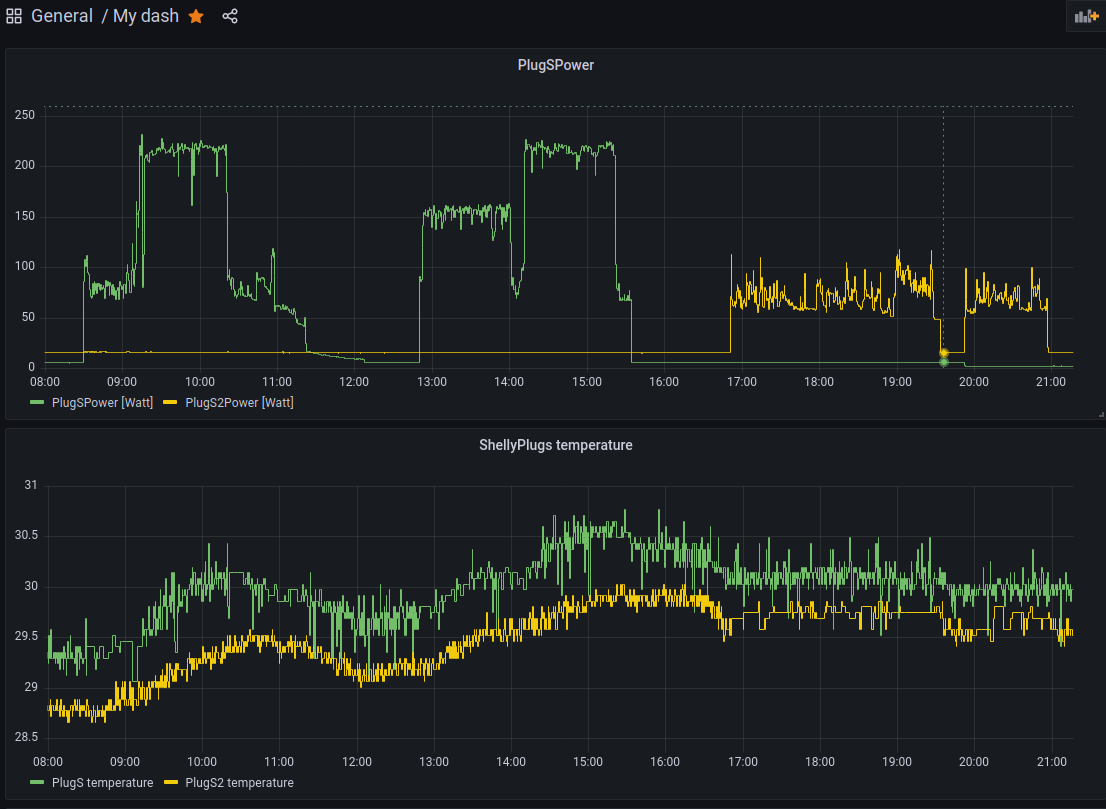
You can change your graph settings and color on the right side in the menu, it’s fairly straightforward, you can create good-looking graphs just like mine below.
Keep in mind if you want to visualize Shelly’s energy values: it sends energy in watt-minute, so you’ll need to divide it by 60 000 to get the kilowatt-hour value.